
Standardized testing reports often look like a confusing mix of numbers and jargon. However, the MAP (Measures of Academic Progress) test is one of the most helpful tools we have to understand your child’s unique learning journey. Unlike traditional "pass/fail" tests, MAP is a GPS—it shows us where your child is, where they’re heading, and how fast they’re getting there.
Here is a quick guide to help you make sense of the report using the key indicators highlighted in your child's results.
1. The Big Picture: Your Child’s RIT Score
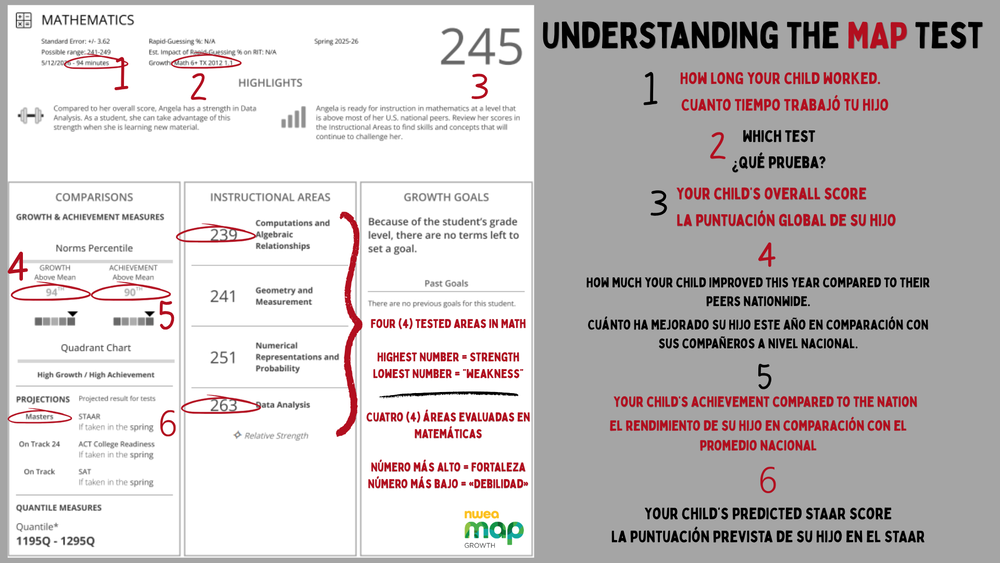
The large number at the top (Point 3) is the RIT score. Think of this like a height chart. It doesn't reset every year; it stays the same from Kindergarten through 12th grade. This allows us to see exactly how many "inches" of academic growth your child has gained over time.
2. Growth vs. Achievement: The Percentiles
The report provides two very important percentages:
Growth Percentile (Point 4): This compares your child’s improvement to other students who started at the same level. If this number is high (like the 94th percentile in the example), it means your child is making progress much faster than their peers nationwide.
Achievement Percentile (Point 5): This is a snapshot of how your child’s current score compares to other students in the same grade across the country.
3. Strengths and "Work-in-Progress" Areas
MAP breaks down subjects into specific categories called Instructional Areas.
Highest Number = Strength: In the example, a 263 in Data Analysis is a clear strength.
Lowest Number = Area for Improvement: A 239 in Computations indicates where the student might need a little extra practice or specialized instruction.
4. Looking Ahead: Predicting Success
Because MAP is so accurate, it can predict how your child will perform on state-wide tests like the STAAR (Point 6). Seeing a projection of "Masters" or "Meets" helps teachers and parents adjust their support long before the state test even begins.
Why Does This Test Matter?
The MAP test isn't about a grade on a report card. It is important because:
It’s Adaptive: The test gets harder or easier based on your child's answers, finding their exact "learning frontier."
It Personalizes Learning: Teachers use these scores to create small groups and tailor lessons specifically to what your child is ready to learn now.
It Measures Effort: By looking at how long your child worked (Point 1), we can see if they took their time to show what they truly know.
The Bottom Line: Don’t sweat a single number. Look for the Growth. If that RIT score is moving up, your child is winning.
Pro-Tip: If you see a high growth percentile but a lower achievement percentile, celebrate! It means your child is working incredibly hard and "catching up" to grade-level expectations at a rapid pace.